CMU Commute Cost Calculator
What a commute costs, in salary
The problem: what a commute really costs
A spreadsheet that needed to travel
When Carnegie Mellon announced a return-to-office policy, my colleague Jon Holmes built a spreadsheet to work out what a commute costs a staff member over a year. The idea and the model are his; I turned it into a web app anyone could open on a phone. It never asks where you live, and it stores and sends nothing.
What it asks, and what it doesn’t
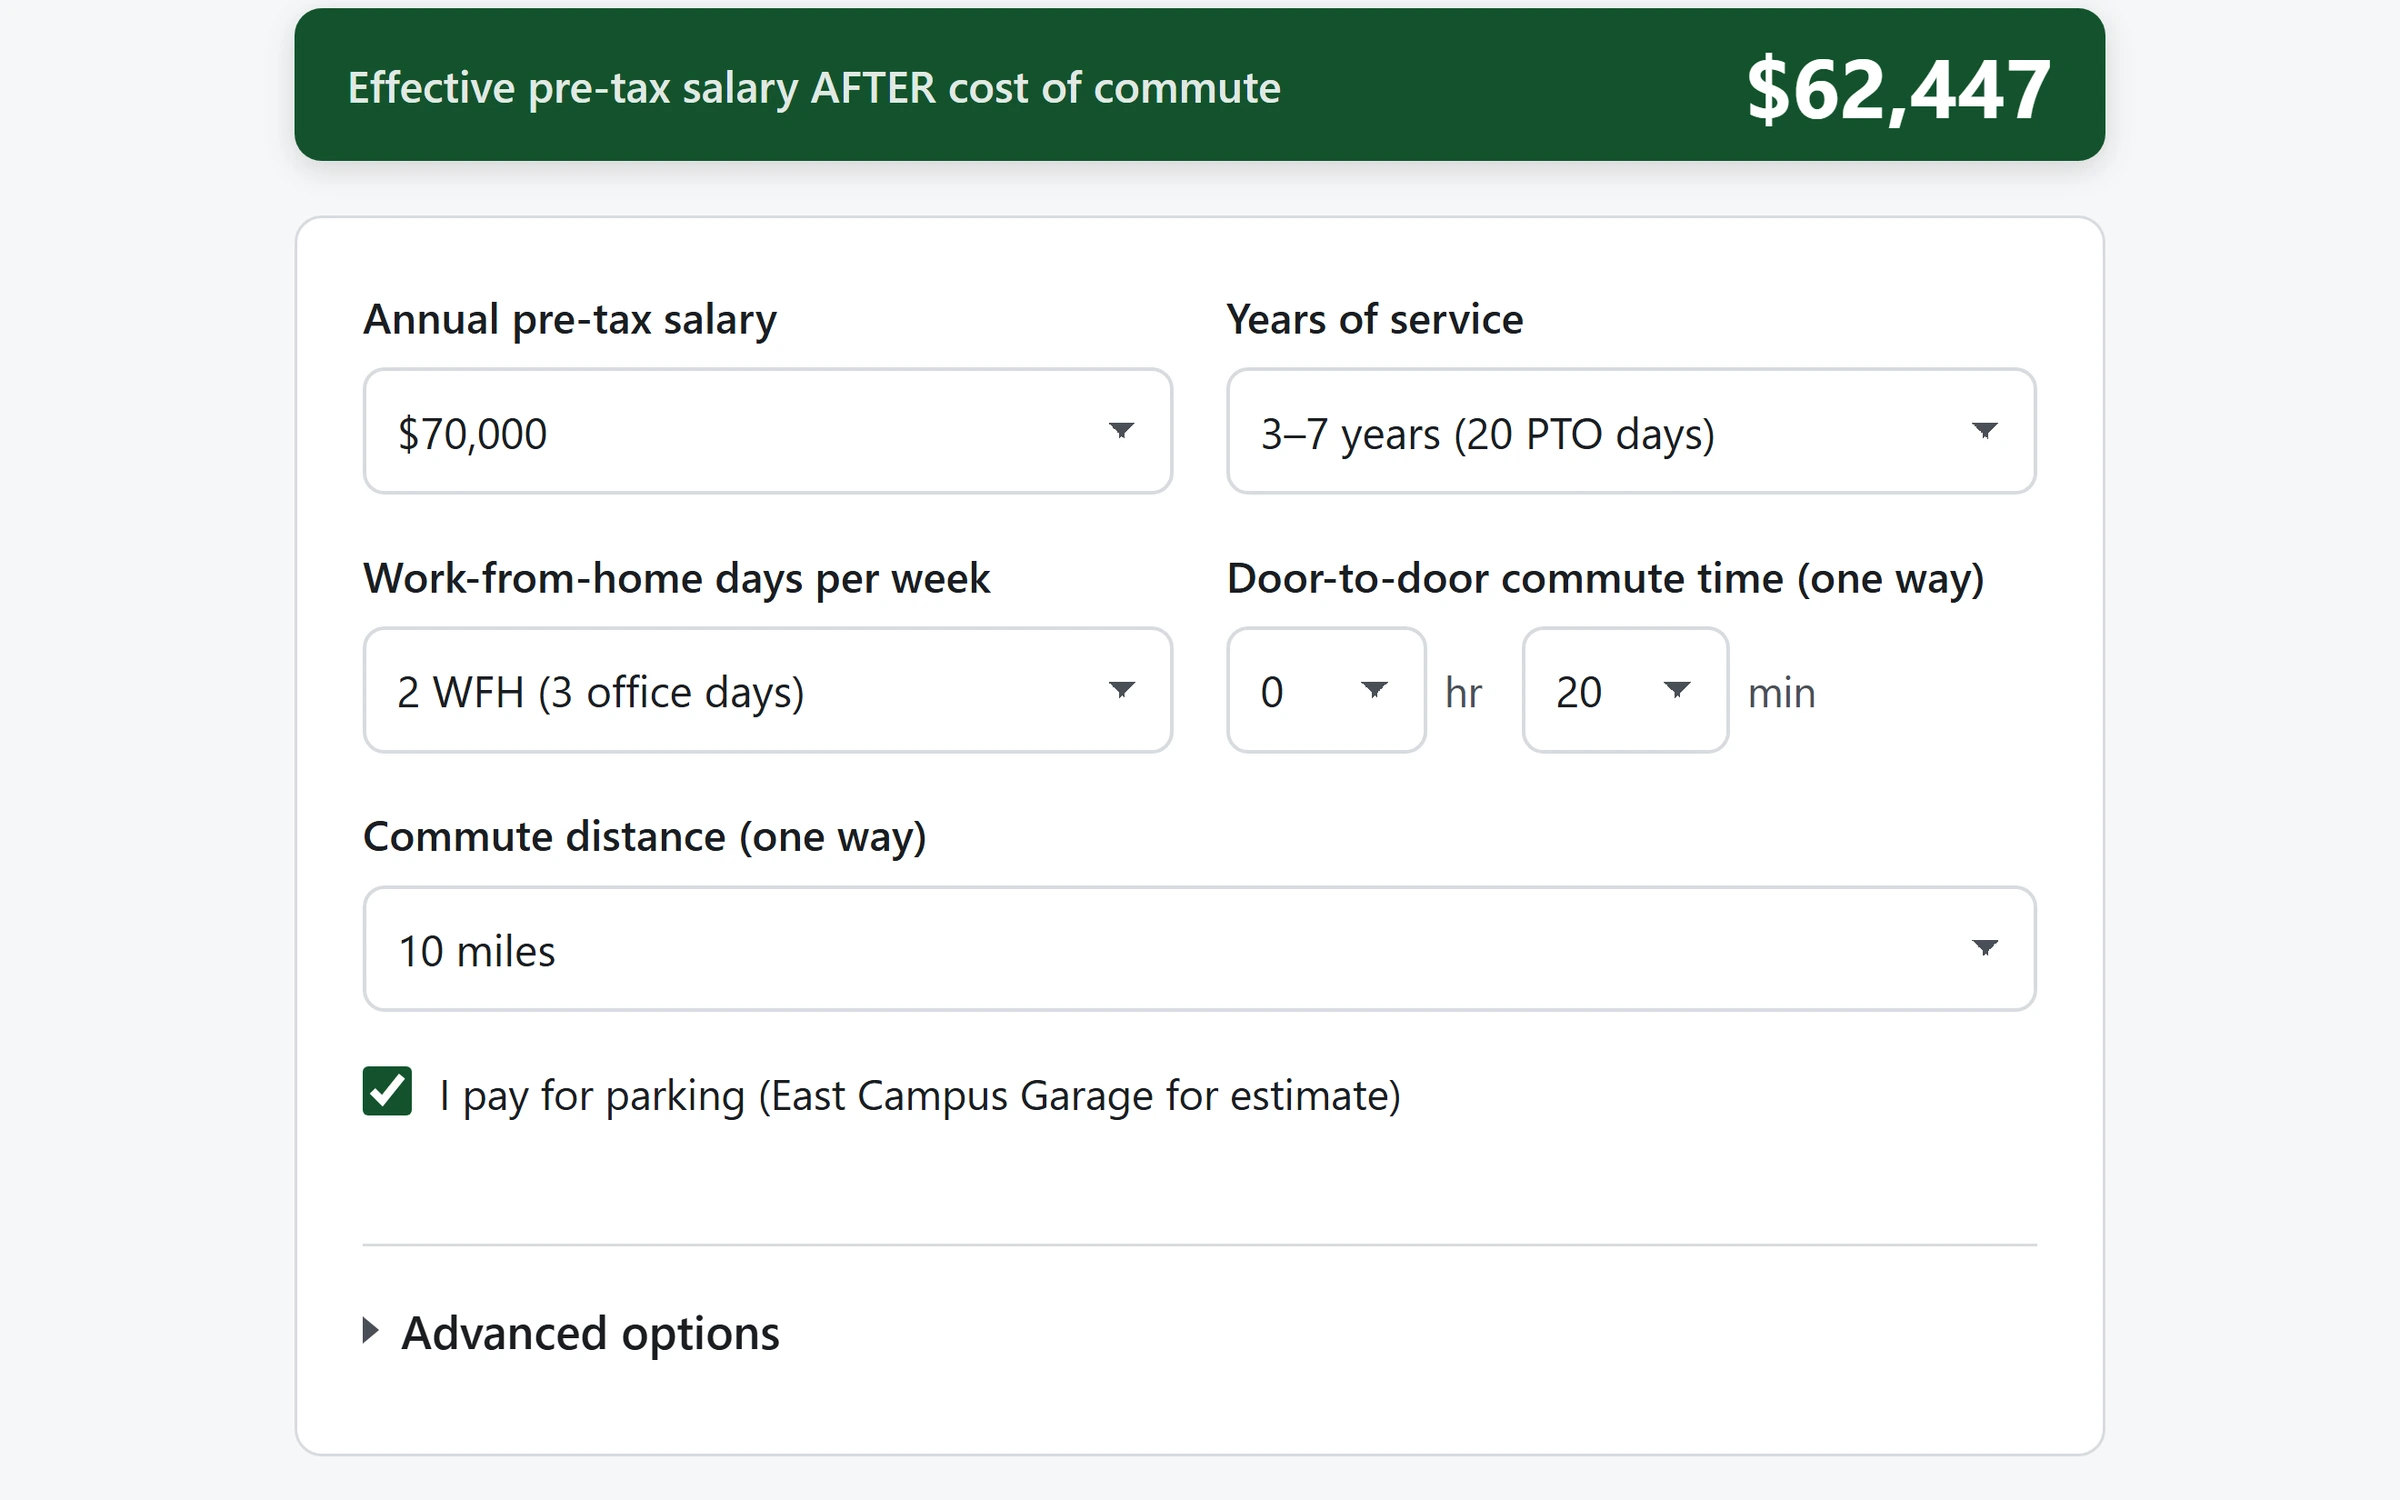
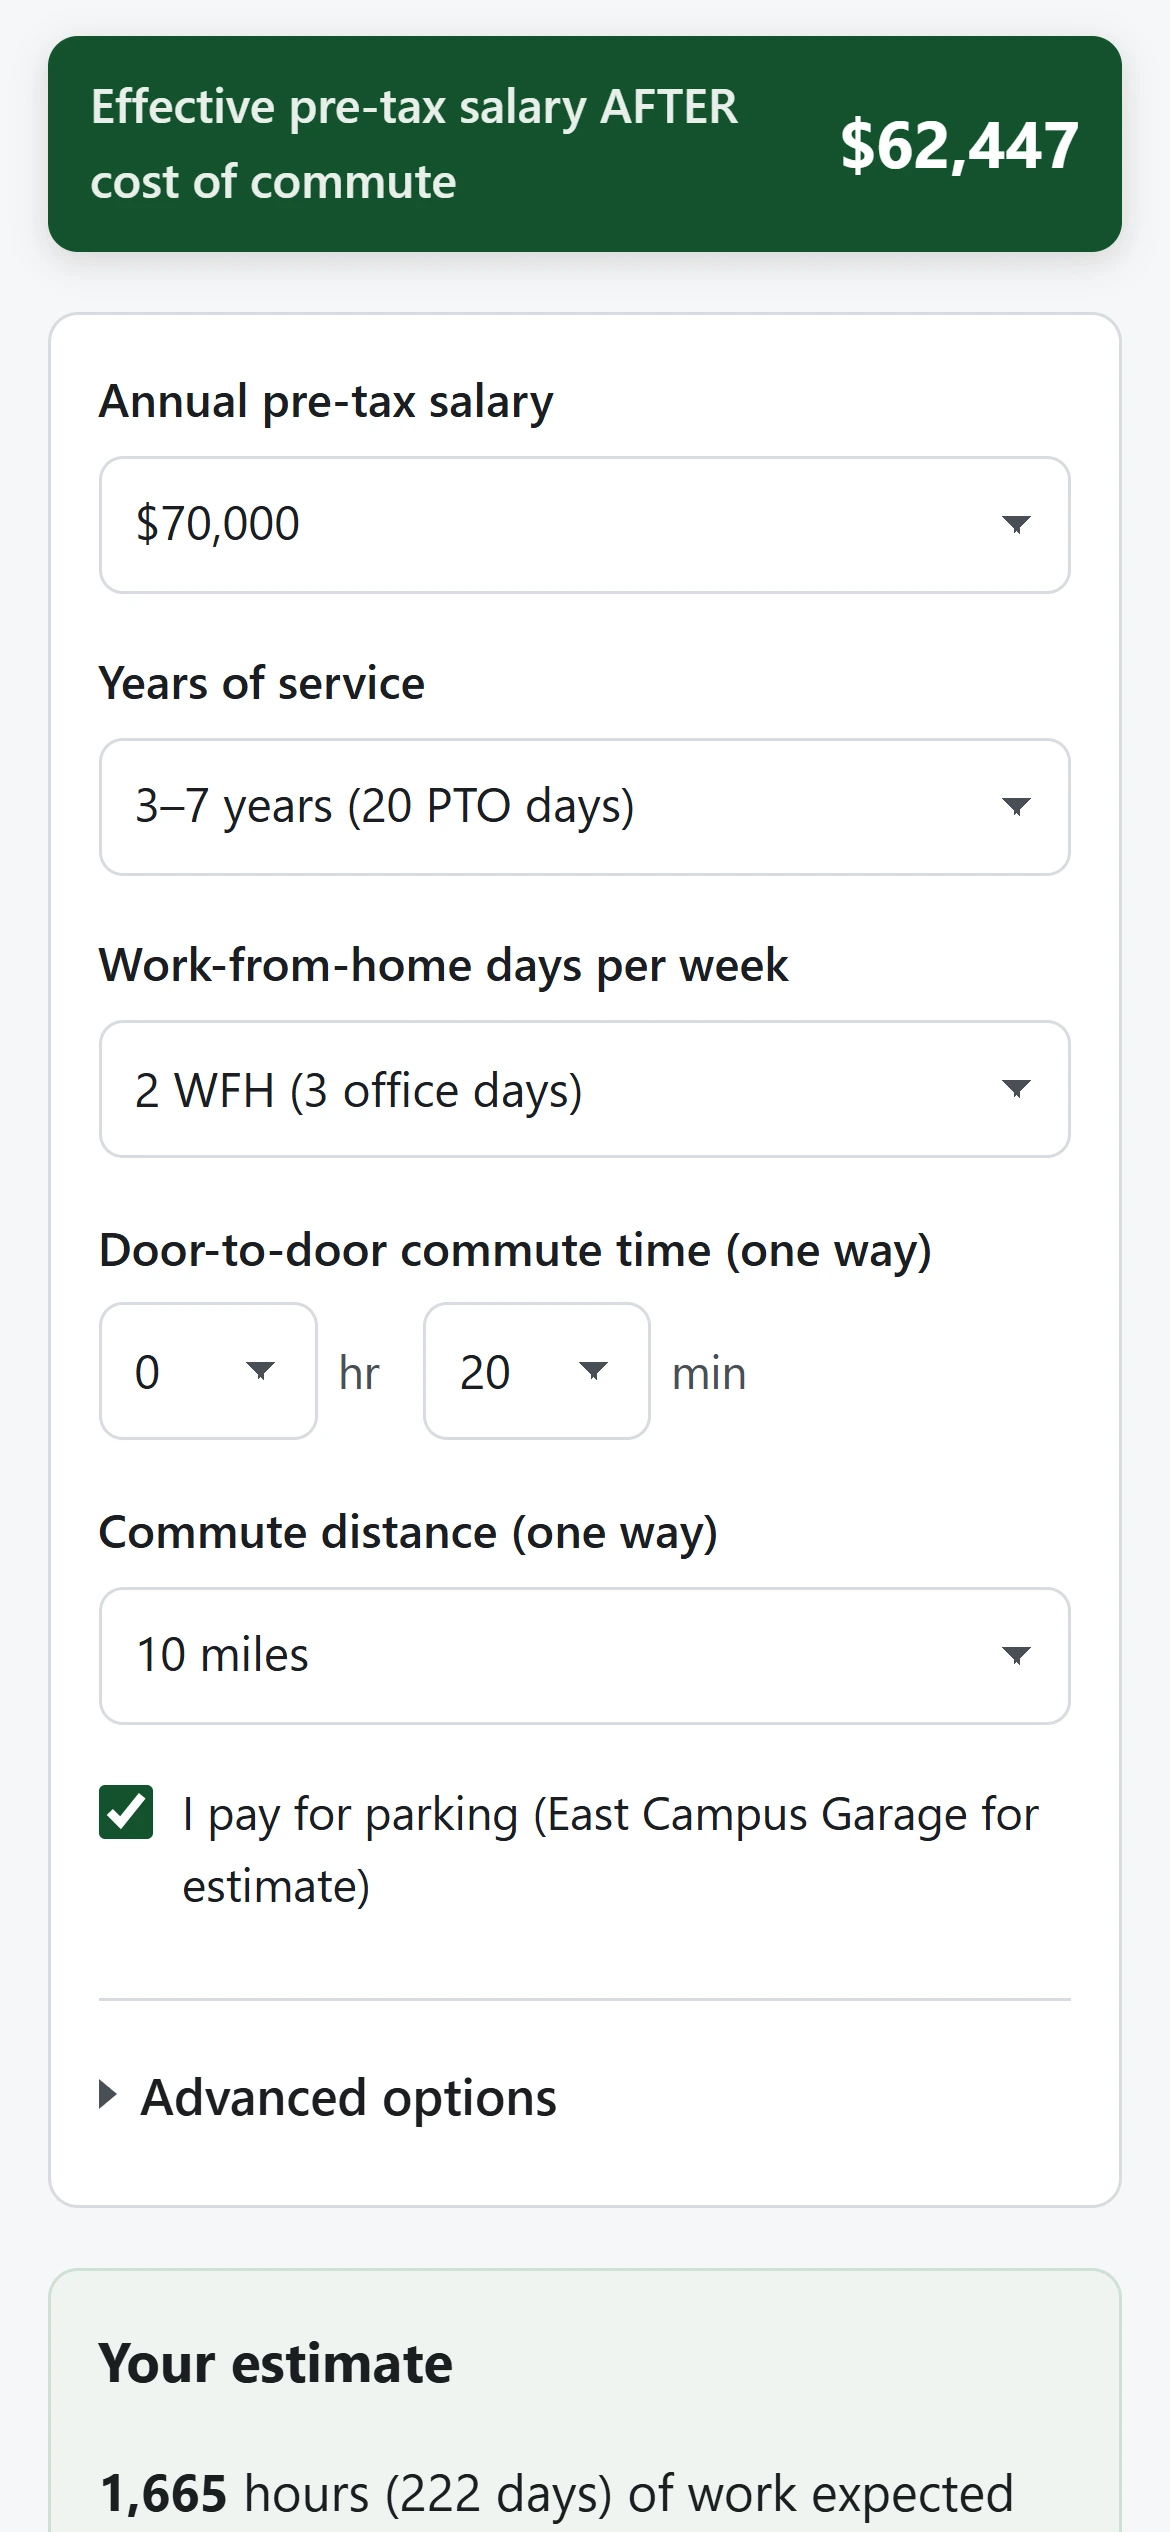
The calculator answers one question: what is my commute costing me, in salary terms? It takes five answers and returns an “effective pre-tax salary”, which is salary minus the value of the time spent commuting, vehicle mileage and parking.
It is not an official CMU tool and says so twice on the page.
- Salary
- $70,000
- What the commute costs a year
- $7,553
- Effective salary
- $62,447
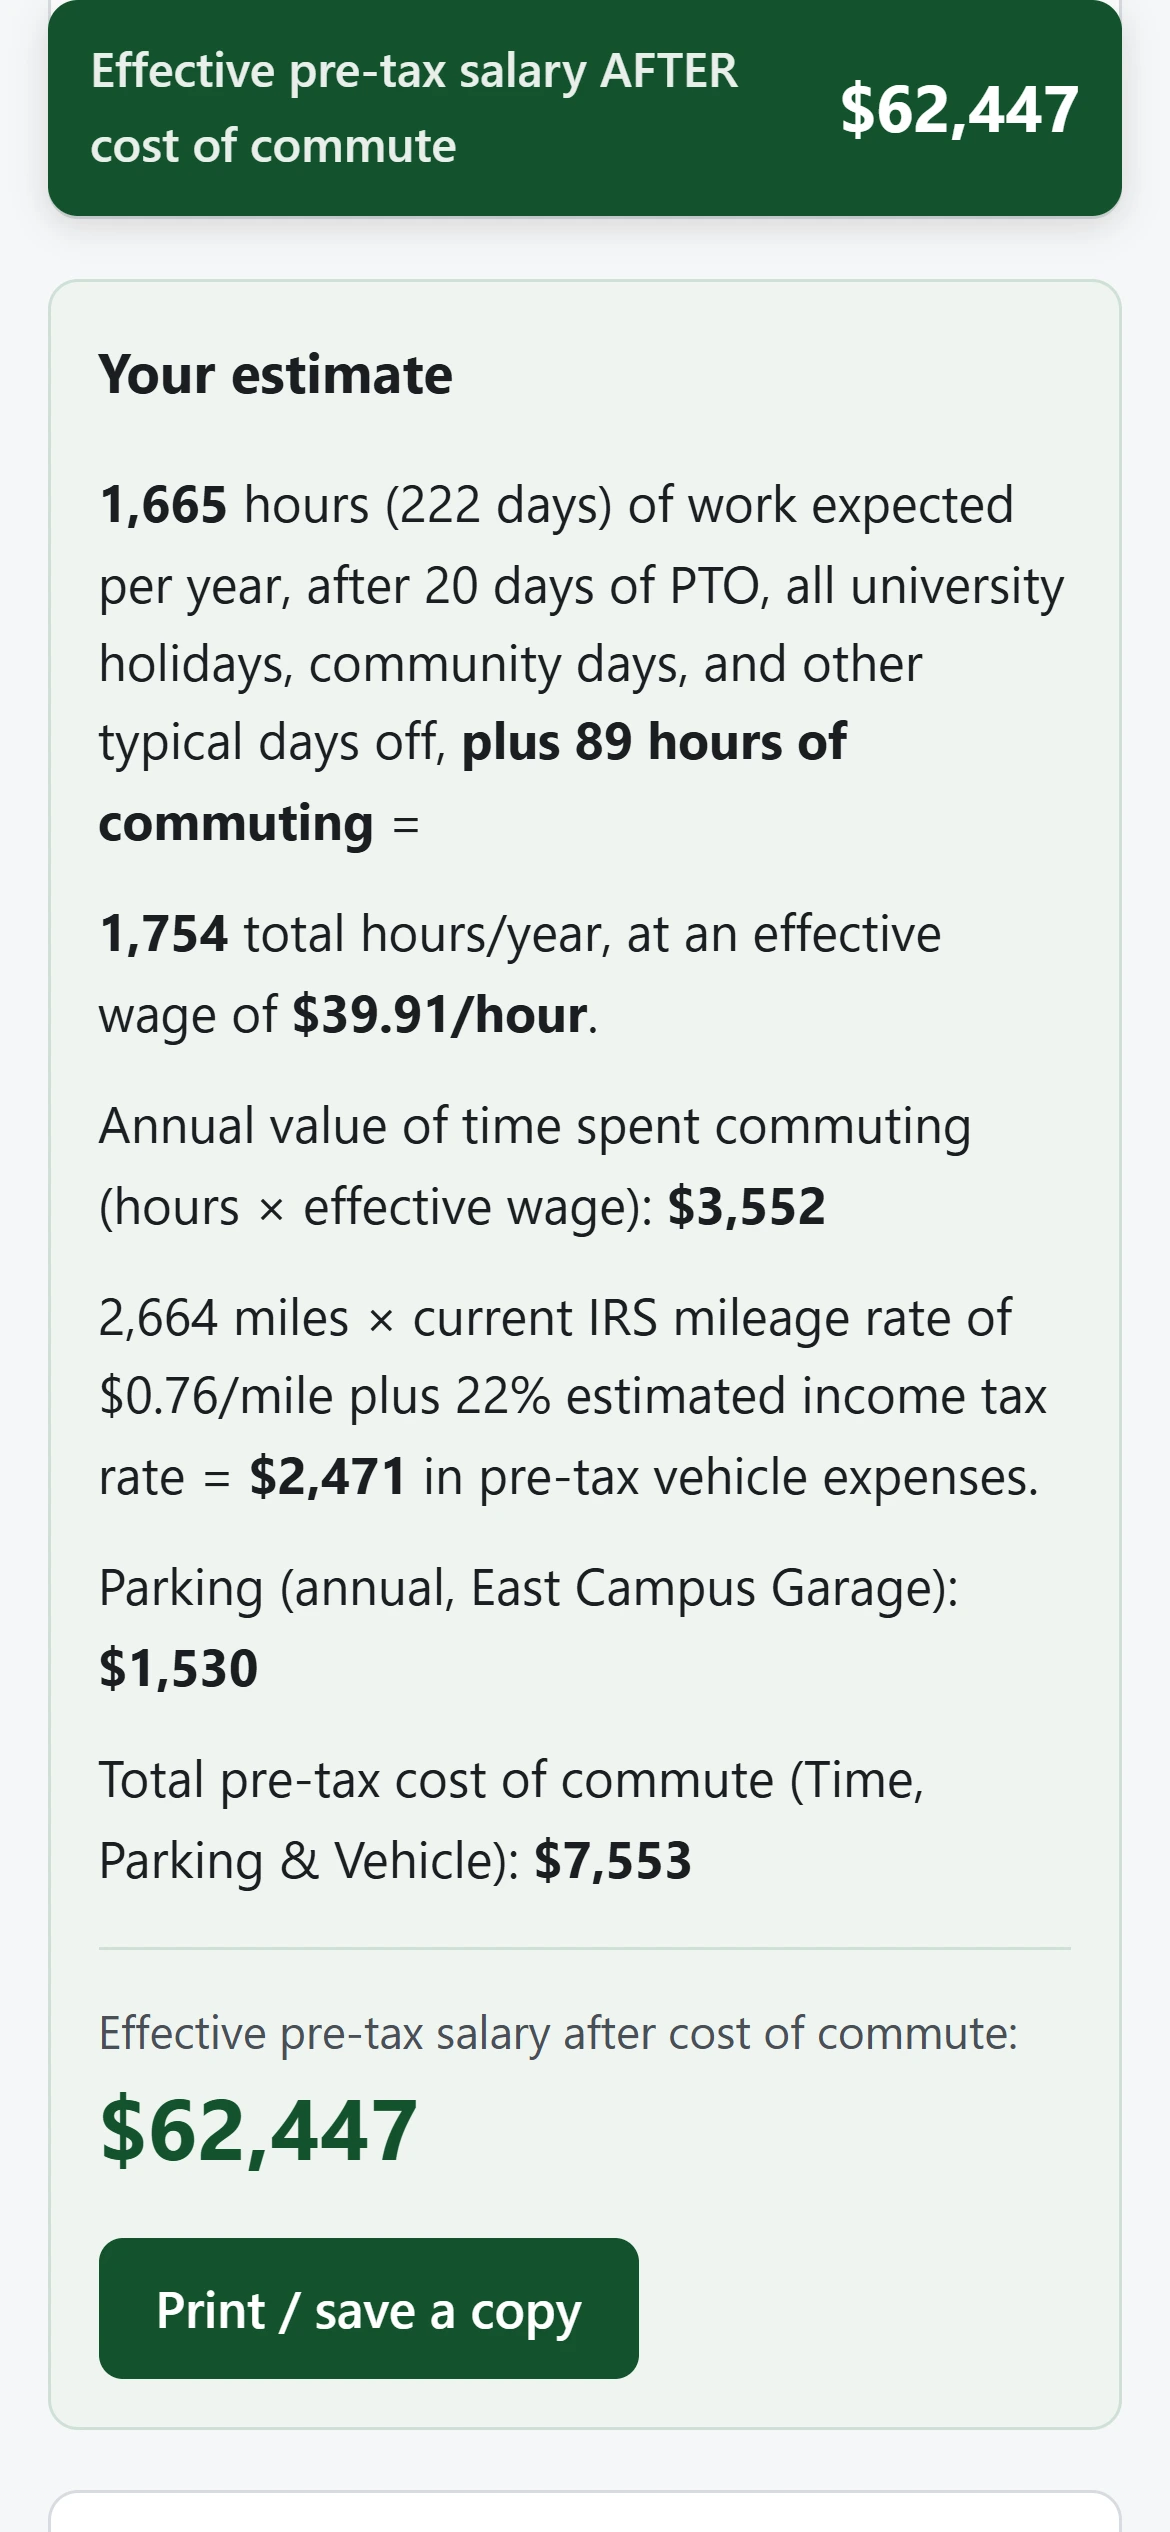
One example from the calculator: three days on campus, 20 minutes and 10 miles each way, paying for parking.
Designing an honest estimate
Your commute is unpaid work
The model treats commuting as unpaid working time. Those hours are added to the hours you work in a year, which lowers your effective hourly wage, and the commute is then priced at that lower wage.
How the numbers add up
Mileage is charged at a per-mile rate and parking at garage rates. In the example above, the commute costs 10.8 percent of pay.
The breakdown shows its work, and a “How is this calculated?” section states each assumption in plain language, including that the estimate is deliberately approximate.
Never blank, never overstated
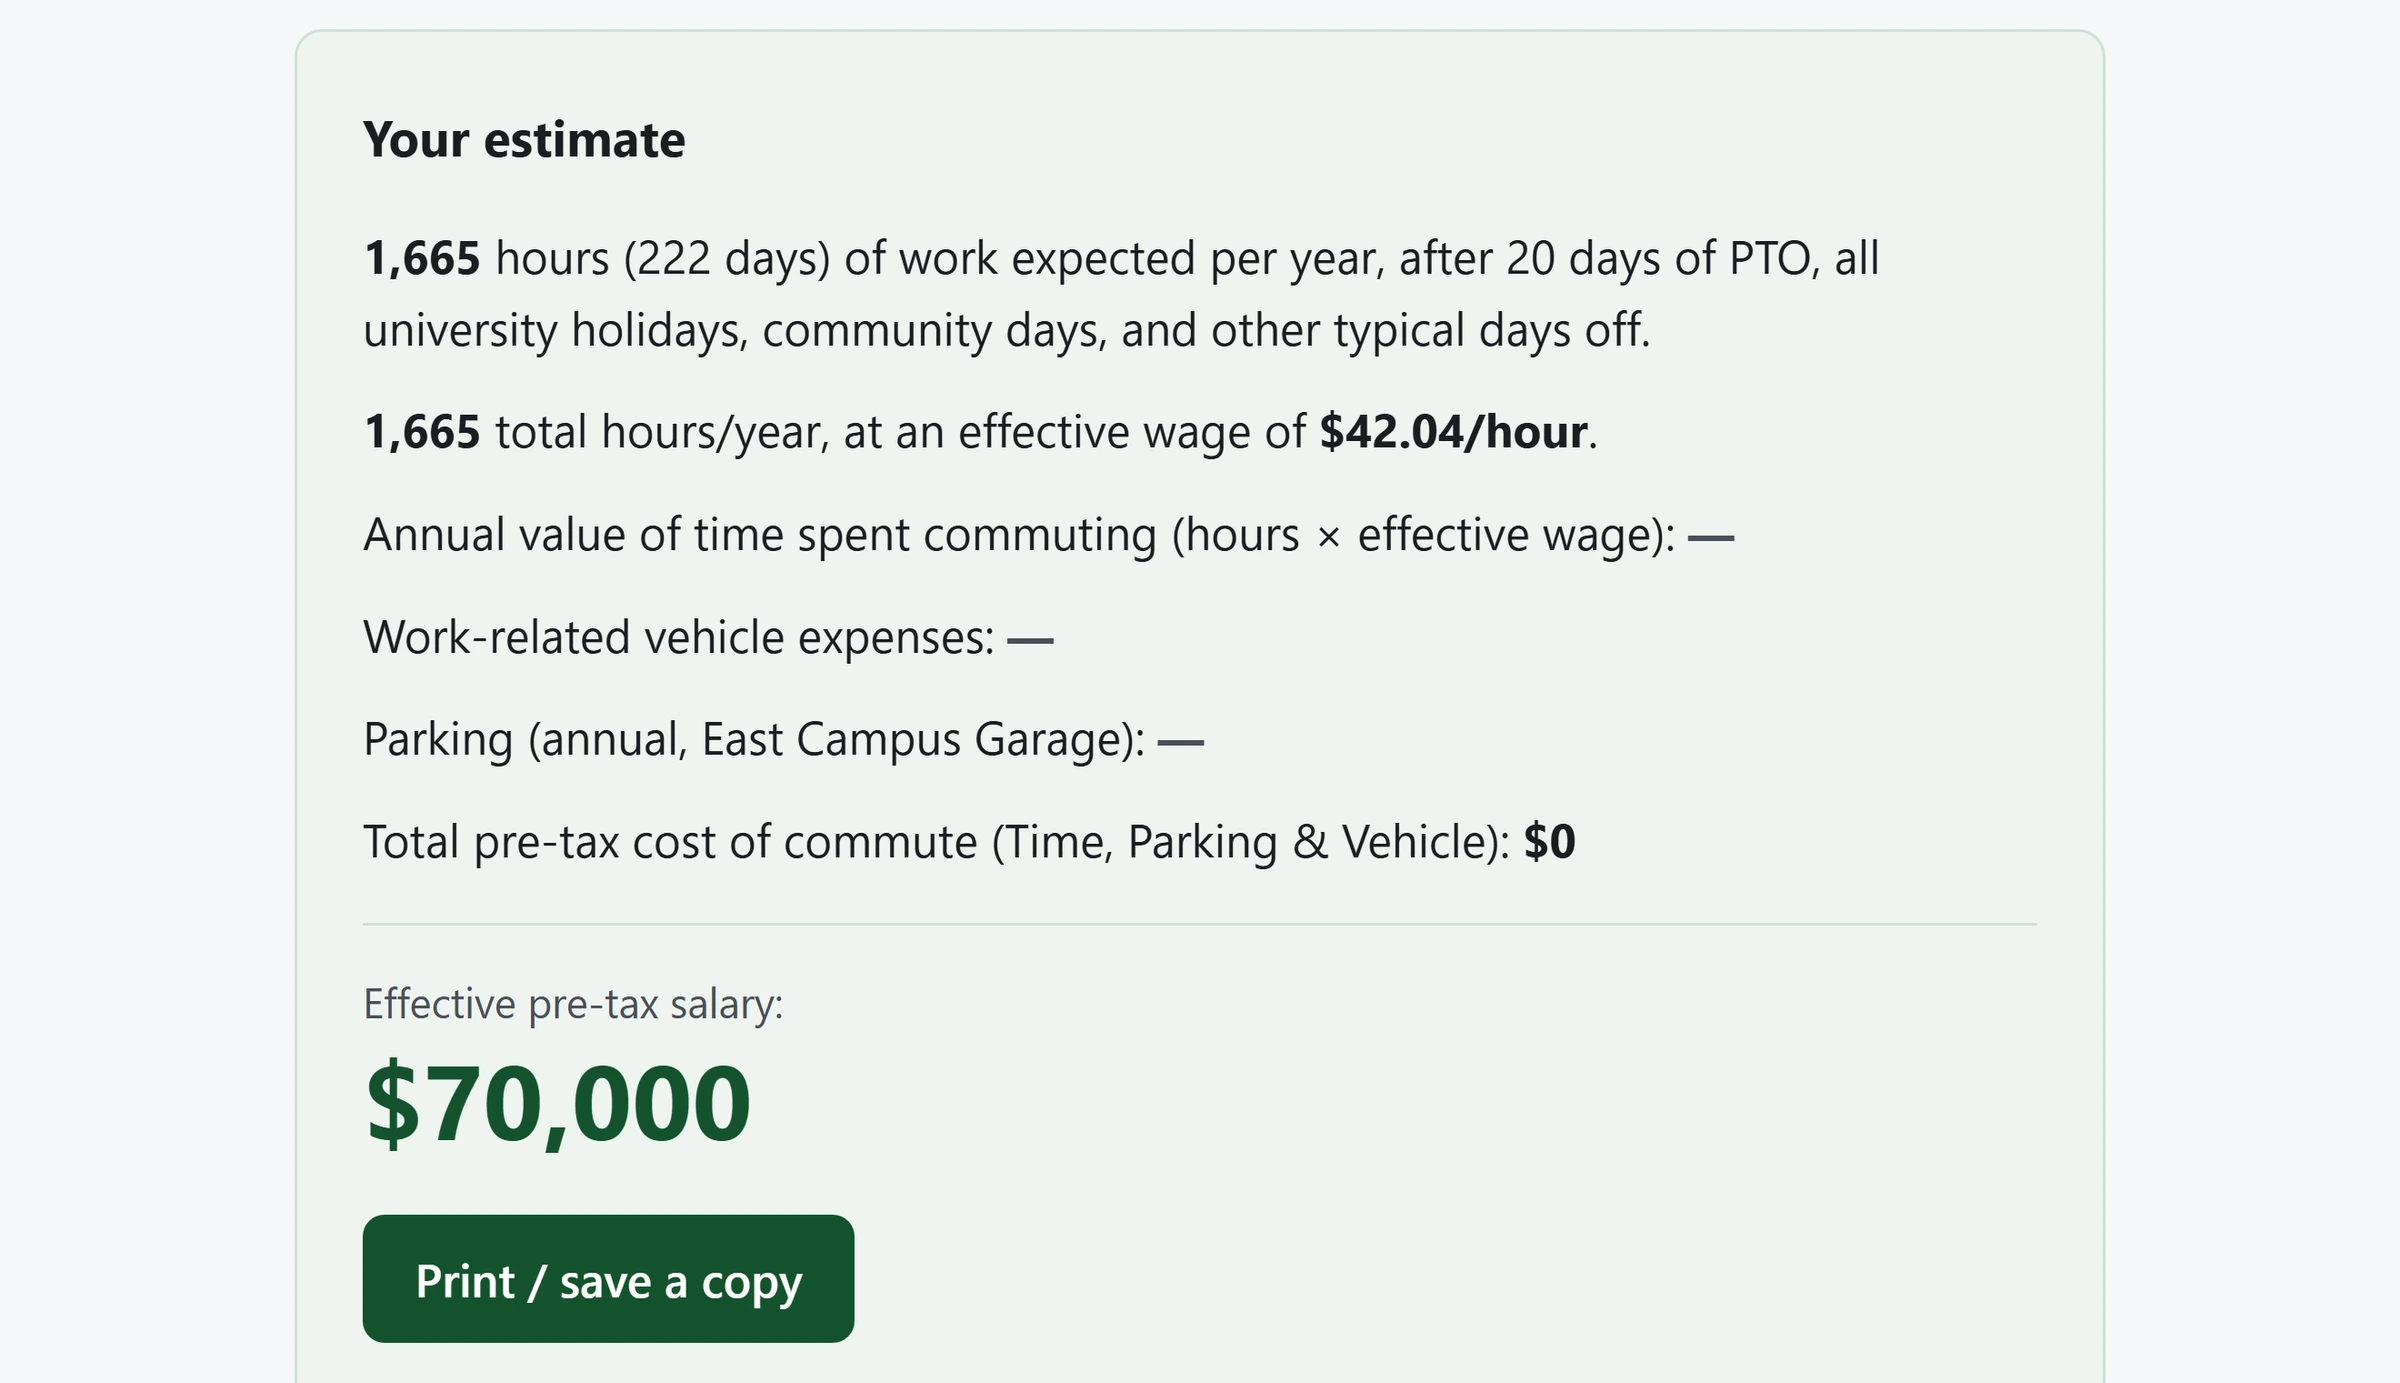
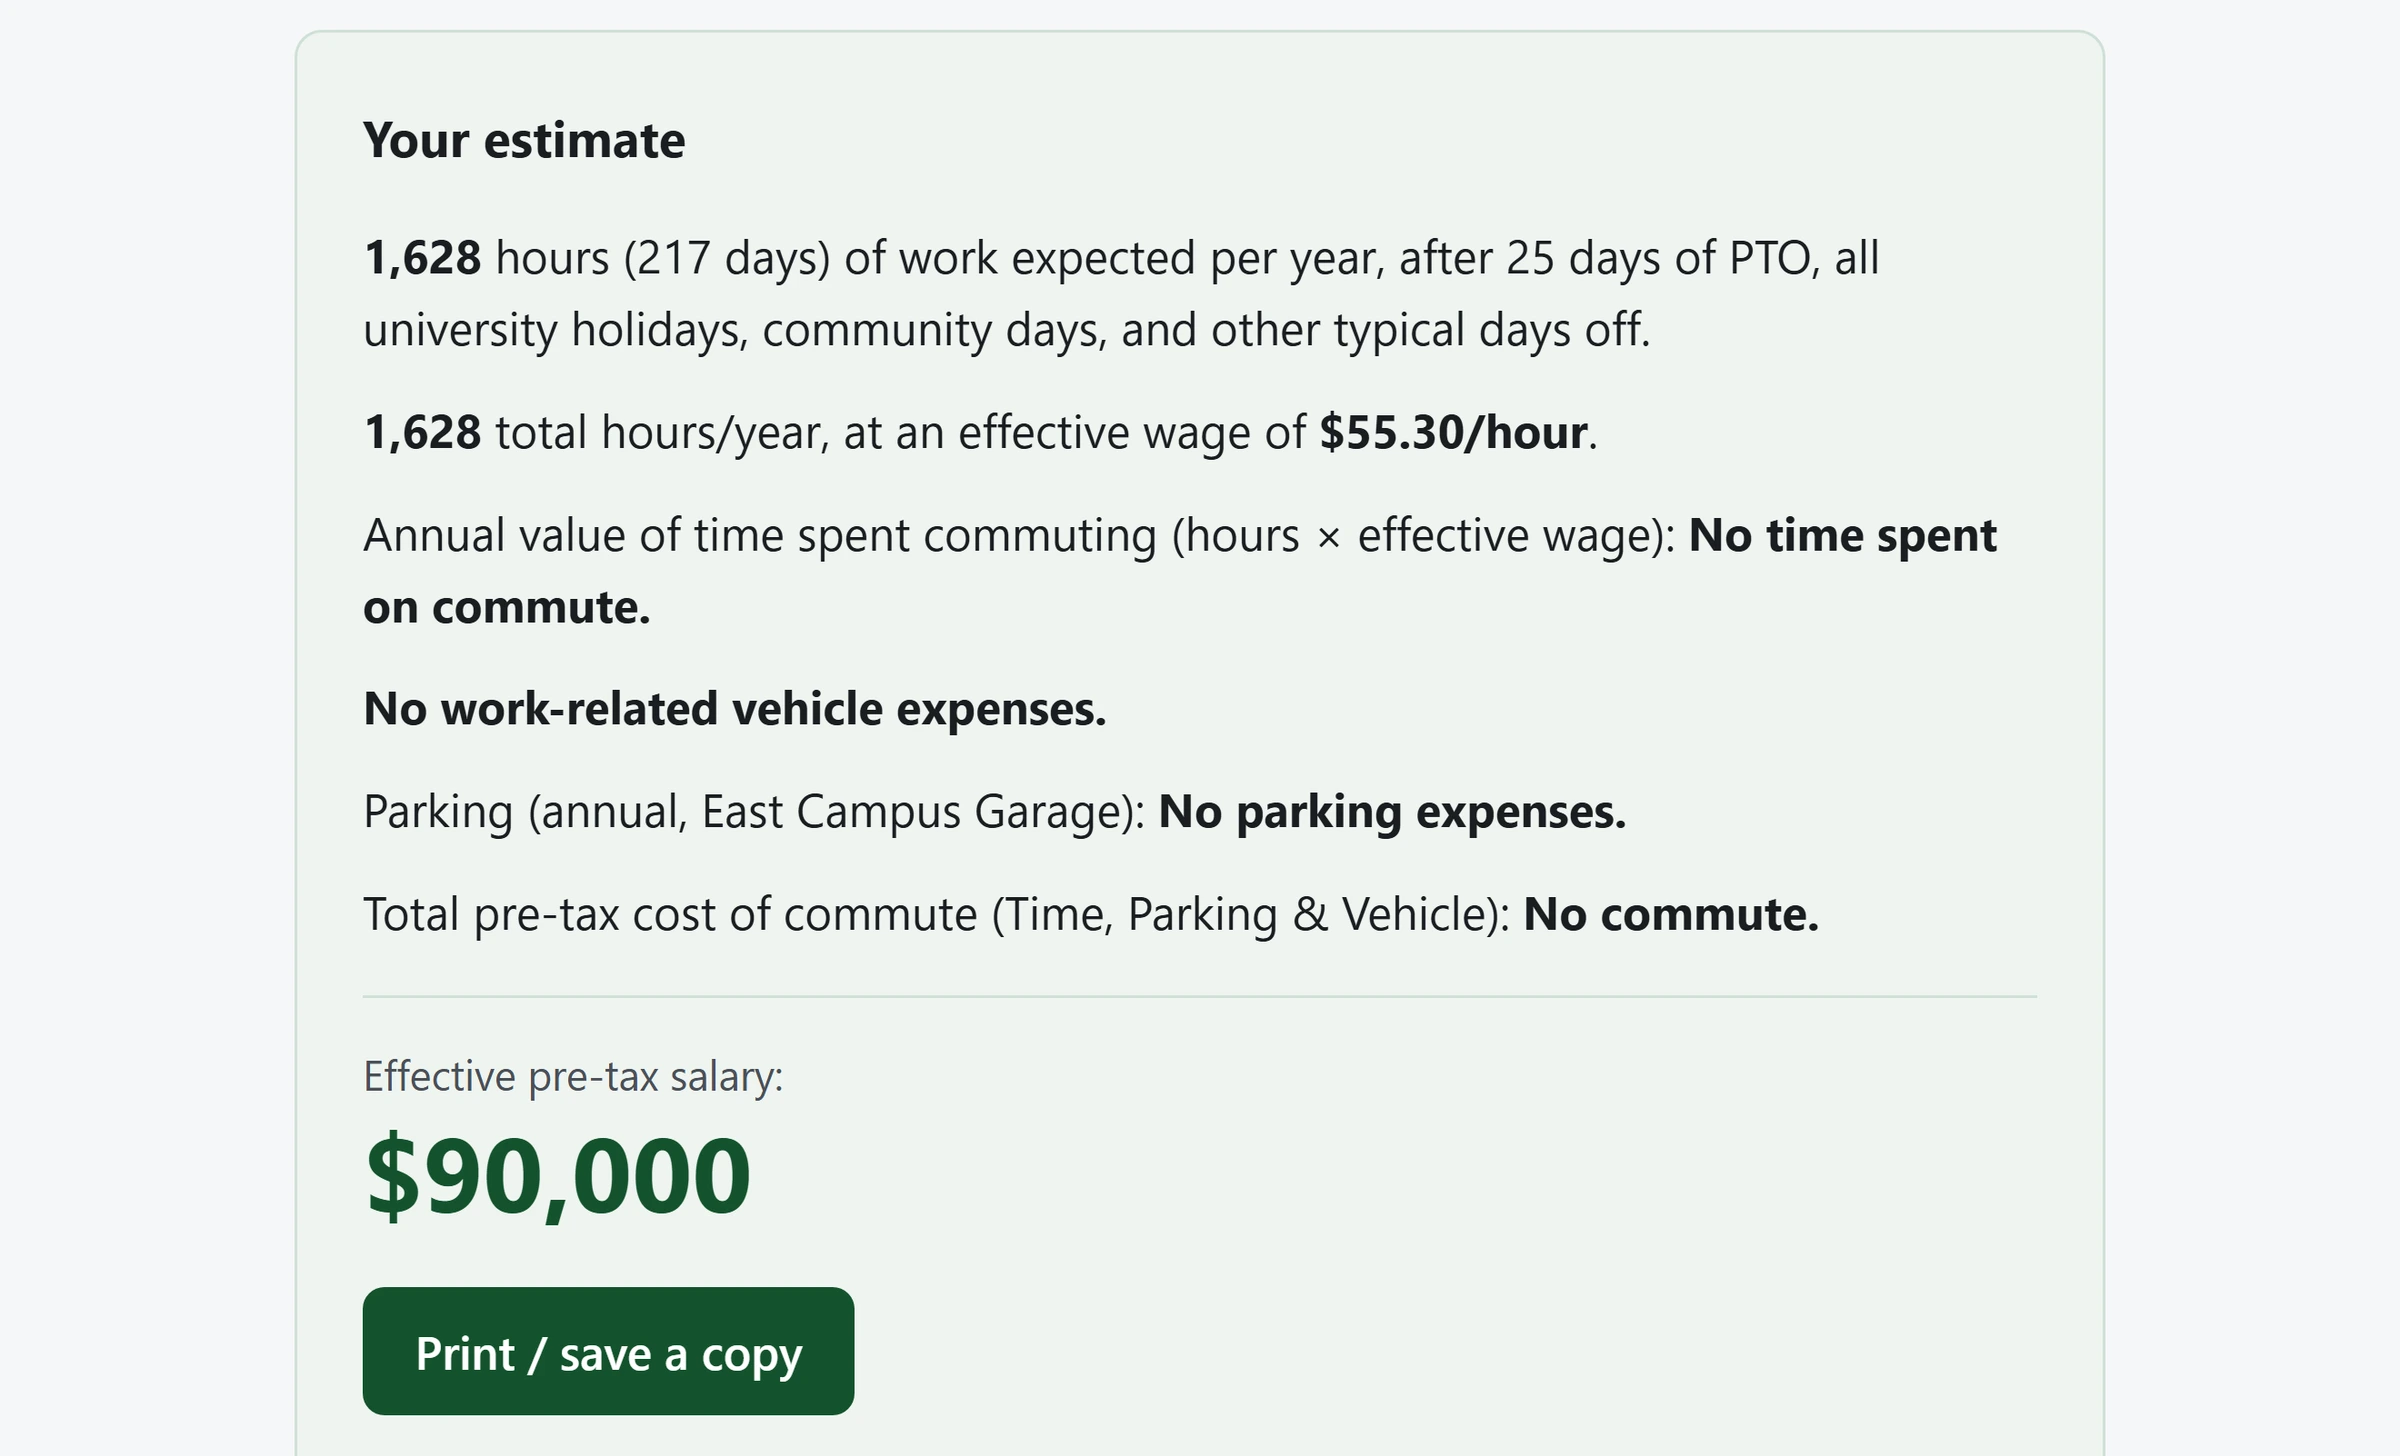
The headline figure appears as soon as a salary is chosen and stays on screen while you answer the rest. A line that is waiting shows a dash; a line that is truly zero says so in words. The banner is the page’s only live region, so a screen reader announces the key number on each change without reading the whole breakdown again.
Why every input is a dropdown
Every input is a dropdown or a checkbox. There is no free text to validate and no address to enter.
A weekend build
Small enough to hand around
The whole thing is four files and about 50 KB, with no framework, no dependencies and no tracking. I built it over a weekend in mid-September 2026, with Claude Code, from a written specification of the spreadsheet.
Keeping the numbers current
Every rate and price lives in one file behind an annual review checklist that names the authority for each value, so someone who is not a developer can update it.
Reception and limits
Nauseating.
Where it landed
It is live at cmucommute.fyi and has been passed between staff by word of mouth. Another staff member said the explanation of the method was very clear. There are no usage numbers, because the app has no analytics by design.
What it doesn’t do yet
It models one commute, driving or not driving, against the alternative of not making the trip. It does not compare transit, cycling or carpooling, and you overwrite your answers to try a second scenario. Side-by-side comparison is the obvious next step.
Two inconsistencies remain. In a fully remote scenario the banner still says “after cost of commute” when the breakdown correctly drops the phrase. And while answers are incomplete, the total reads $0 above component lines that still show dashes. The tax and mileage figures are hard-coded and need checking against published rates each year.